High turnover does not always mean high profits. Discover the story of London Fresh Market, which, through basket analysis, not only understood its customers but also increased its margin by 10% in just six months. See how data transformed their business from within.

Daily work in a grocery store is a constant juggling of tasks: orders, deliveries, customer service, team management. With such a large dynamics, it’s easy to focus on turnover, confusing it with actual profit. This story shows how one store in London, using data it already had, increased its margin by 10% without hiring an army of analysts.
The story of this store is similar to many other Polish establishments in the UK. A good location, loyal customers, and an owner who knew his assortment inside out. Despite this, at the end of the month, profits did not reflect the effort put in and the scale of sales. The problem lay in decisions based mainly on intuition rather than hard data.
Market Basket Analysis is a technique that involves discovering relationships between products purchased simultaneously by customers. It is much more than just knowing what sells best. It answers the question: “What sells together with what?”. A sales report will show you that you sold 100 loaves of bread and 50 packs of ham. Basket analysis will tell you that in 40 transactions, bread and ham were on the same receipt. This simple information opens up huge opportunities for optimizing sales, promotions, and store layout.
The owner of London Fresh Market, like many entrepreneurs, relied on his observations. He saw that customers often bought drinks and snacks, so he ordered more of them. He created promotions based on what was piling up in the warehouse or what suppliers suggested. The result? Some promotional items sold out quickly, generating low profit, while other products, often those with high margins, gathered dust. There was a lack of a coherent strategy, and every decision was fraught with the risk of error. Fatigue and a sense of acting in the dark grew, even though the store was bustling with life.
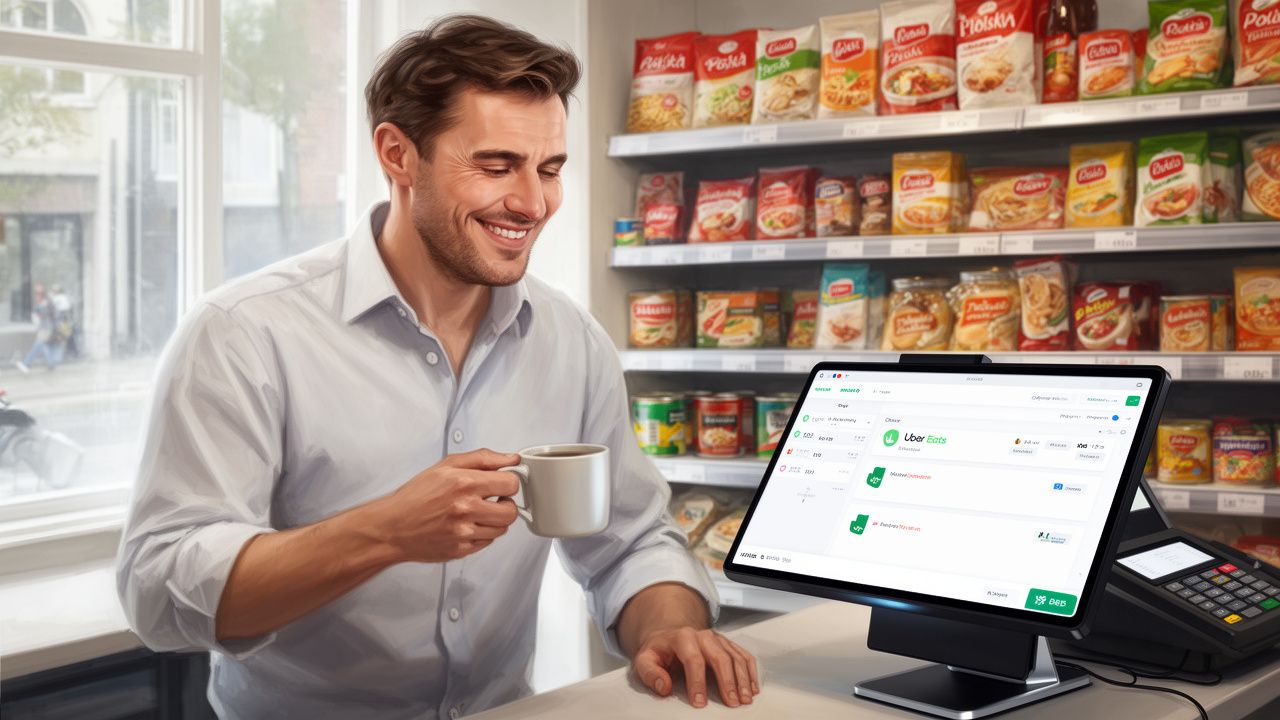
The breakthrough came with the decision to implement a modern POS system that offered a module for analyzing sales data. It was not a complicated corporate-class system, but an accessible tool designed for retail. The key was that the system automatically collected and processed data from each receipt. Instead of spending hours reviewing spreadsheets, the owner gained access to clear dashboards and reports. He focused on analyzing a few key indicators: the most common product pairs, the average basket value at different times of the day, and the impact of one product’s promotion on the sales of others.
After six months of regular, weekly data analysis, the results exceeded the wildest expectations. The store’s gross margin increased by 10%. How was this achieved?
This is not an isolated case. The owner of a store in Manchester, analyzing weekend receipts, discovered that customers regularly created their own “grilling sets.” He introduced ready-made packages – sausage, blood sausage, bread, and sauce – which turned out to be a hit and simplified shopping while guaranteeing the store a higher margin than selling individual products.
Many myths have arisen around sales analytics that discourage independent store owners. It’s time to dispel them based on real experiences.
Fact: Perhaps it was once true. Today, technology has become accessible and scalable. Modern POS systems for small and medium businesses often come with built-in analytical modules as standard or as an inexpensive add-on. The cost of implementing such a system is an investment that, as the example of London Fresh Market shows, pays off within a few months through margin optimization and loss reduction.
Fact: Customer loyalty and a good relationship with them are the foundation, but they cannot replace data. Basket analysis allows you to discover hidden patterns and needs that customers themselves would not tell you. Perhaps they buy cake ingredients in your store, but go to the competition for cream because yours is at the other end of the store. Data is an objective source of knowledge that complements your daily observations.
Fact: This is one of the most harmful myths. Effective analysis does not involve manually sifting through thousands of receipts. Modern software does it for you. Your task is to spend 30-45 minutes once a week reviewing ready-made, visual reports and drawing conclusions. This is less time than it takes to solve one problem with a wrong delivery.
Fact: Basket analysis shows that this is not true. Increasing margin often involves smarter selling, not more expensive selling. It’s about building the offer and store layout in such a way that customers naturally put more products in their baskets, especially those with higher profit for you. Strategic promotions on some products can drive sales of other, more profitable ones, increasing the overall transaction value without scaring customers away with prices.
Fact: Experience and intuition are invaluable, but in today’s competitive world, that’s not enough. Treat data as a partner to your intuition. They will allow you to verify your hunches, avoid costly mistakes based on false assumptions, and make decisions with greater confidence. Does your intuition suggest that a new product will be a hit? Data will show you what customers might buy it with, helping you plan its perfect placement in the store from day one.
The story of London Fresh Market is proof that technology is no longer a distant tool but a practical support in the daily running of a store. What should you remember?
The end of the quarter is an excellent time for an audit of the tools you have. Look critically at your cash register system and consider whether it provides you with the information needed for strategic development or just records sales. Perhaps, like London Fresh Market, you are sitting on a gold mine, you just need the right tools to start extracting it.